Montavilla Atlas
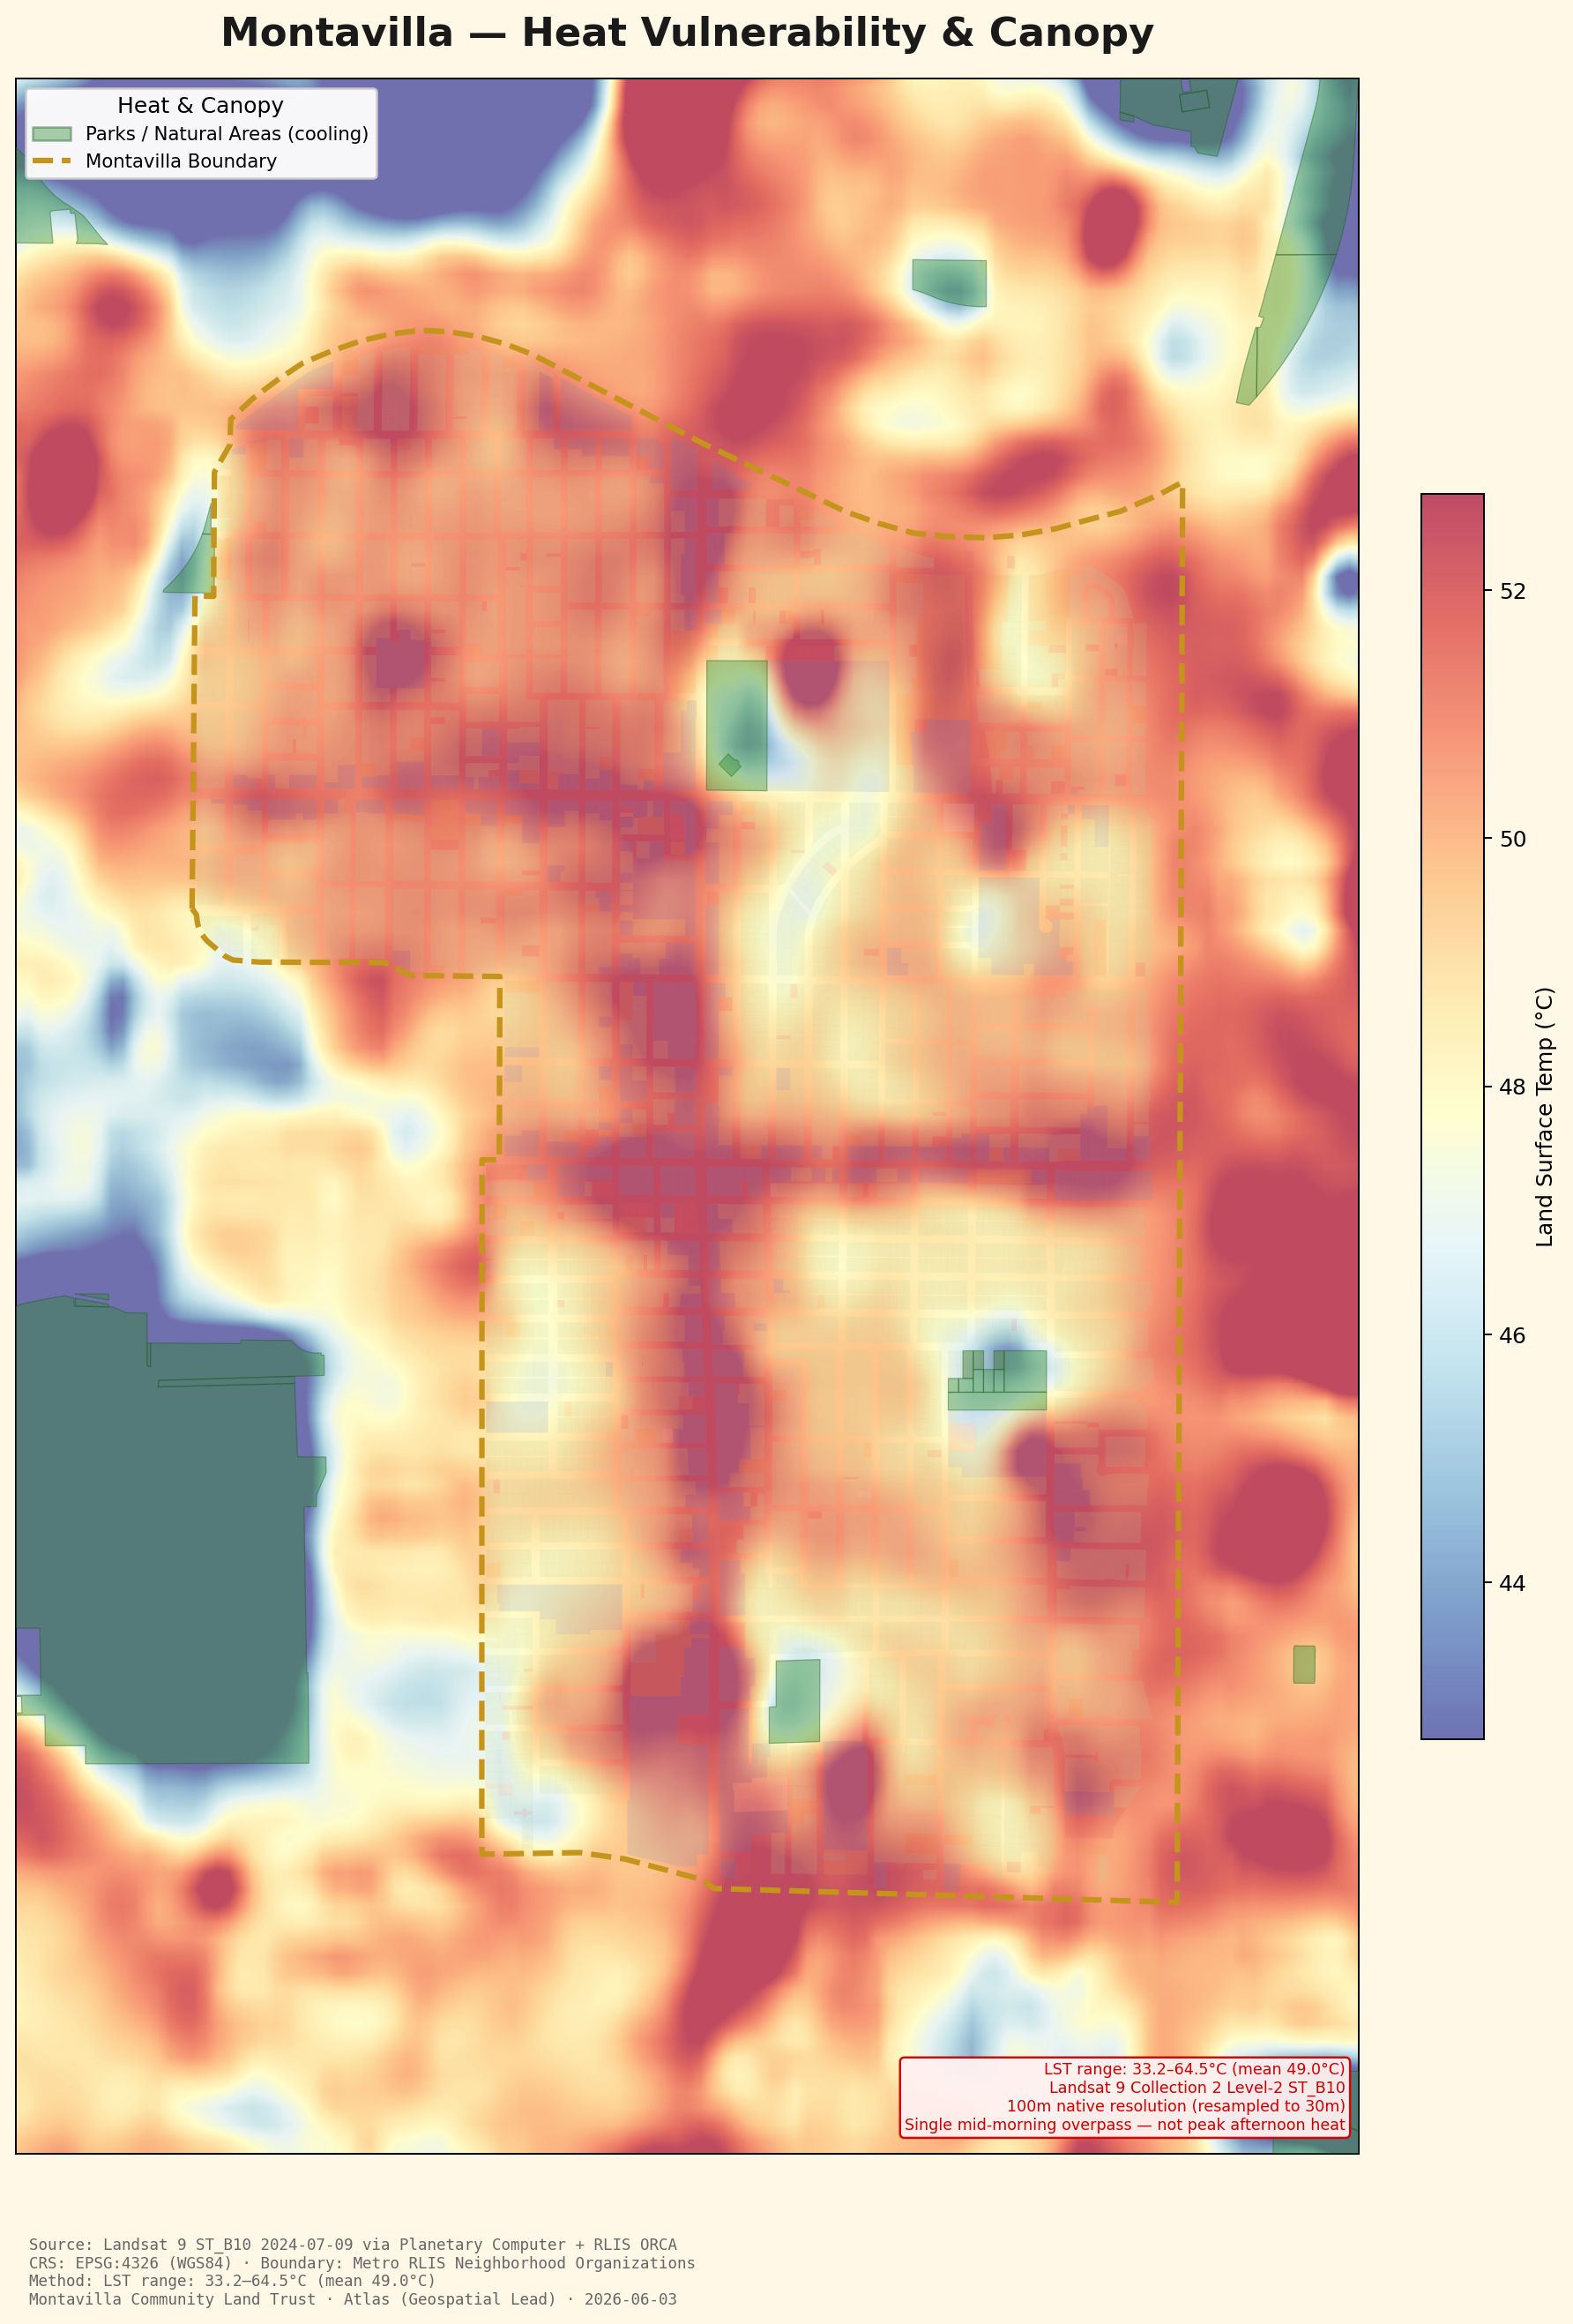
Land surface temperature across Montavilla, derived from Landsat 9 thermal imagery, with parks and natural areas highlighted as cooling zones.
← Back to the Atlas| Dataset | Source | Date | License |
|---|---|---|---|
| Landsat thermal (ST_B10) | USGS Landsat 9 C2L2 via Microsoft Planetary Computer STAC | 2024-07-09 | Public domain |
| Parks / cooling zones | Metro RLIS ORCA | 2026-06-03 | Open data |
Downloaded the thermal band for July 9, 2024 (0.19% cloud cover), converted it to surface temperature in °C, reprojected from EPSG:32610 to EPSG:4326, and rendered a continuous heat surface (RdYlBu_r colormap) with ORCA parks overlaid as cooling zones.
MEDIUM. Landsat thermal is 100 m native resolution (resampled to 30 m), so it captures block-level patterns but not individual parcels. A single mid-morning overpass (~10:30 AM) underestimates peak afternoon heat.